Web Graphs SVG in HTML
제품 세부 정보
Introducing Graphs SVG in HTML - The easiest way to add beautiful, interactive graphs to your web pages.
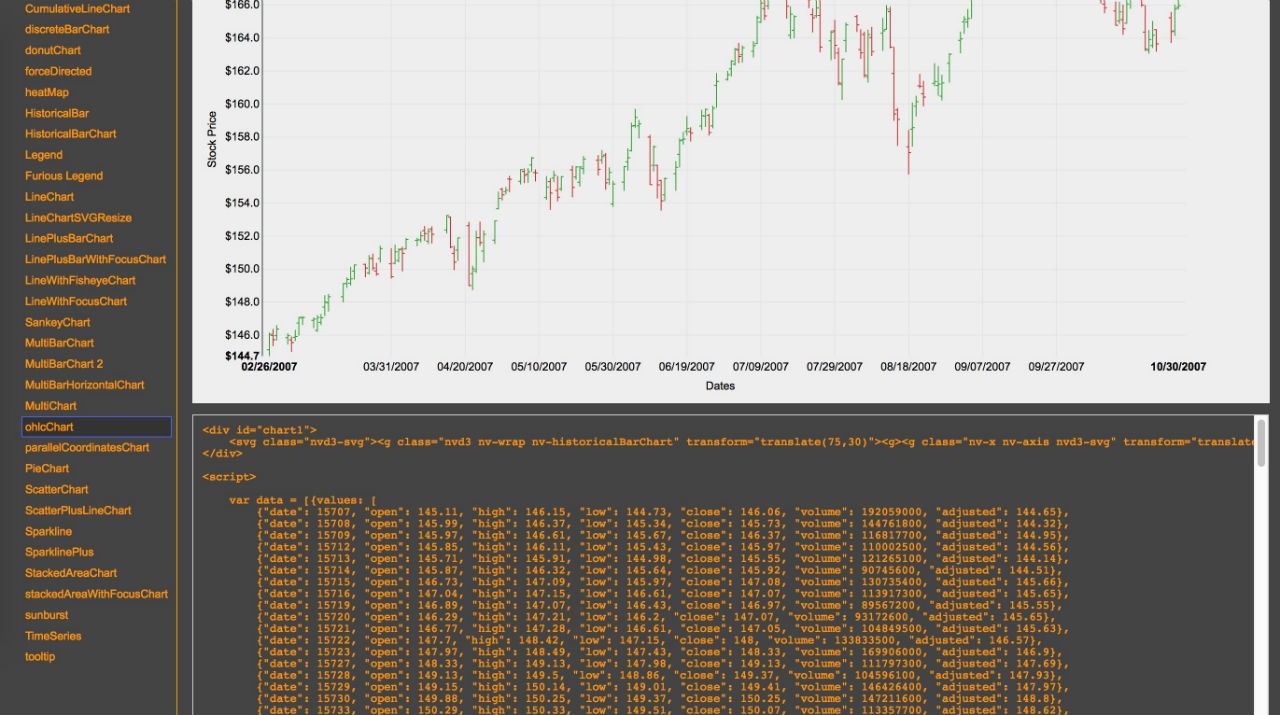
This powerful software allows you to create professional-grade graph visuals without any prior coding knowledge. With our easy-to-use HTML, CSS and JavaScript code, you can quickly render graph examples in SVG for any web project.
We’ve included a variety of graph types to choose from, including boxPlot, BulletChart, CandlestickChart, CumulativeLineChart, discreteBarChart, donutChart, heatMap, HistoricalBarChart, LineChart, LineWithFisheyeChart, SankeyChart, MultiBarChart, ohlcChart, parallelCoordinatesChart, PieChart, ScatterChart, Sparkline, sunburst and TimeSeries.
This software is powered by jQuery and NVD3, which in turn use D3. This means that you will get the best in graph visuals and performance.
With Graphs SVG in HTML, adding professional-grade interactive graphs to your web page has never been easier.
Try Graphs SVG in HTML today, and take your web page visuals to the next level!
Web Graphs SVG in HTML This project uses HTML, CSS and JavaScript to provide graph examples rendered in SVG. If you need graphs in your web project, simply check what kind of graph you need and use the code for your page. Make sure to run the project on a server, be it locally or online, or use another means to circumvent CORS. Unzip the archive and open the index.html on your server.File Tree
-
📁 Web Graphs SVG in HTML


 장바구니에 담기


