React Module Crypto Charts
Desarrollador
Hablar con el vendedor
Detalles del producto
Charting the BTC Price Action with React
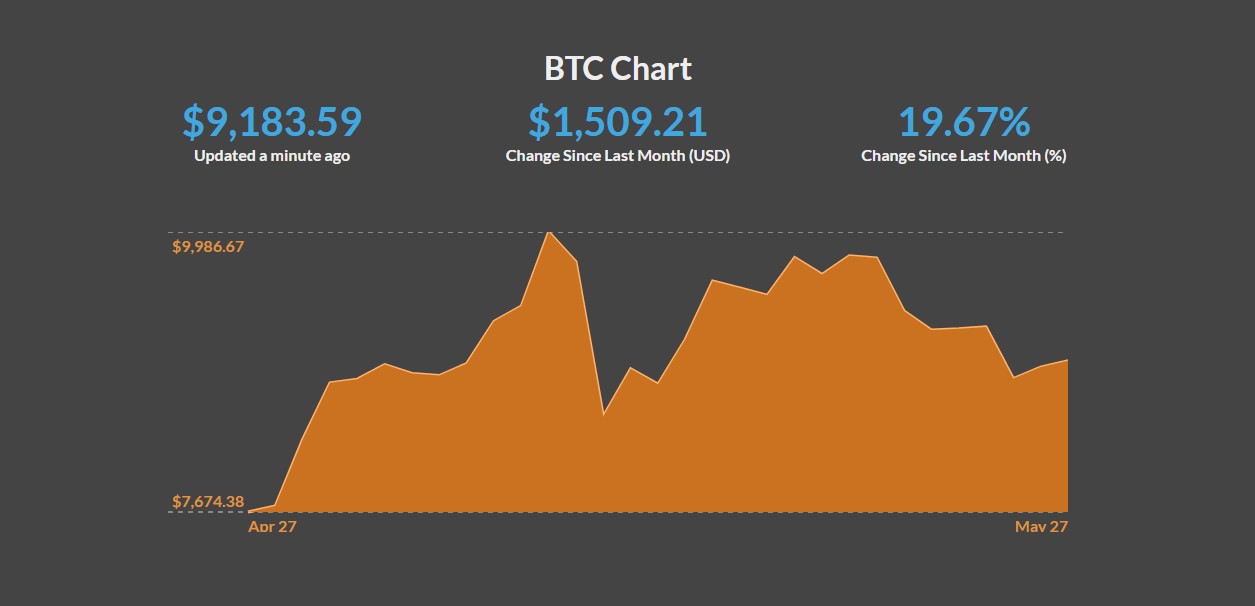
Are you looking for an easy way to chart the BTC (Bitcoin) price action? Look no further! Our code base makes it easy to chart the price action with React. By default, this shows a 30 day chart with daily prices that can be easily changed. Data is provided by Coindesk, and a mouse hover effect displays a tooltip of the day and price.
Benefits of Our Code Base
- Include this in any existing React project
- Change the data to show a different timescale or a different crypto
- Flexible code base
- Technologies used: HTML, CSS, NPM/NODE, React, JavaScript
This code base is a great solution for anyone who wants to track the BTC price action using React. It's easy to customize and use, and the data is provided by Coindesk. With this code base, you can easily include it in any existing React project, change the data to show a different timescale or a different crypto, and the flexible code base makes it easy to personalize and adapt.
Why Choose Us
Our code base is easy to use and customize, has a flexible code base, and is built with modern technologies like HTML, CSS, NPM/NODE, React, and JavaScript. We also provide data through Coindesk, and a mouse hover effect displays a tooltip of the day and price. With our code base, you can easily monitor the BTC price action in any existing React project.
Ready to Get Started?
If you're ready to get started charting the BTC price action with React, don't wait any longer! Our code base is easy to use and customize, and provides a great way to monitor the BTC price action in any existing React project. Contact us today to get started with our code base.
Data is provided by coindesk. Mouse hover effect shows a tooltip of the day and price. Easily include this in any existing React project. Flexible code base.File Tree
-
📁 React Module Crypto Charts


 Añadir al carrito


